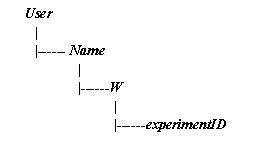
1. Index Tree
A scrollbar is added on top of the tree panel. So you can scroll to view the information, if the tree extends the panel.
2. Different views in the TabbedPane
• The program execution of each process
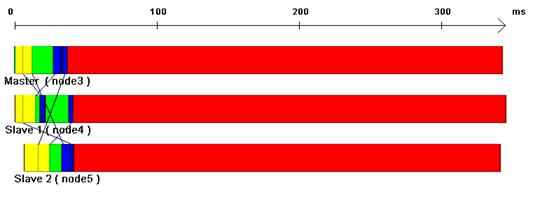
Just as what you had seen above, t he timeline shows the program execution of each process.
Whenever you switched to this view, the data concerning this current view (“Experiments”, “Phases” and “Processes”) will be sent from the Index Tree. The following matters are just “read” and “display”.
There are 3 processes here, 1 Master and 2 Slaves.

The graph can be amplified by the slider beneath it. When you amplified the graph, everything will grow bigger including the timeline.
The colors of this graph can be changed arbitrary by double-click the corresponding rectangles from the part of “Legend”.
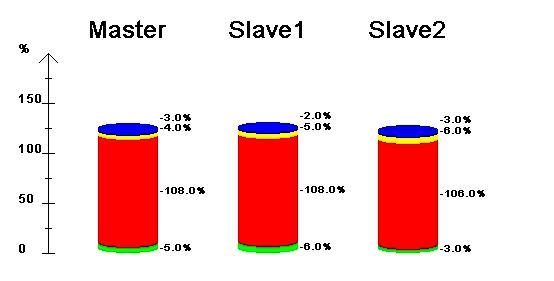
• The resulting performance
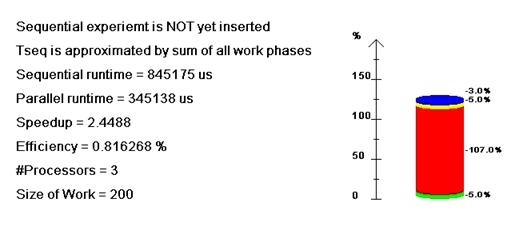
As shown above, there are two parts here.
Whenever you switched to this view, the data concerning this current view (“Experiments”, “PhaseDurations”) will be sent from the Index Tree. The left part contains the basic experimental parameters like “speedup”, “efficiency”, “.sequential time”, etc. Concerning the right part, it uses the data “PhaseDurations” which processID = -1 to draw a cylinder about the resulting performance. The percentages shown above are the total phase durations divided by the sequential runtime.
Also, the colors of this graph can be changed arbitrary by double-click the corresponding rectangles from the part of “Legend”.
• The cost of each phase per process
As shown above, the graph gives the cost of each phase per process.
Whenever you switched to this view, the data concerning this current view (“Experiments”, “PhaseDurations”) will be sent from the Index Tree. It uses the data “PhaseDurations” which processID > -1 to draw lots of cylinders. The percentages are the phase durations per process compared with the sequential runtime divided by the number of processors. The average useful work per process should be around 100 percentages.
The colors of this graph can be changed arbitrary by double-click the corresponding rectangles from the part of “Legend”.
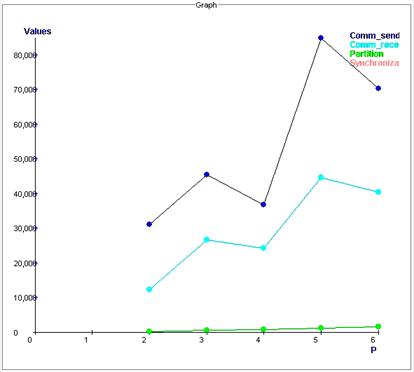
• Performance/Overhead in function of number of processors (p)
As the picture shown below, it gives the points of some parameters (e.g. speedup, Tp) in function of the number of processors (p).
Assuming that you had chosen an experiment from the left side Index Tree, and then you switched to this view. Obviously, additional information of other experiments will needed for this drawing. Relative data will be loaded at the moment of switching, and will be kept in the Data Interface. So that means all data will only be read once.
There is a camera button on the left of the graph. That is used to take pictures of the current graph for the further scientific use. The default path for the picture saving is “C:\”. The default format of the picture is JPEG.
• Performance/Overhead in function of problem size (W)
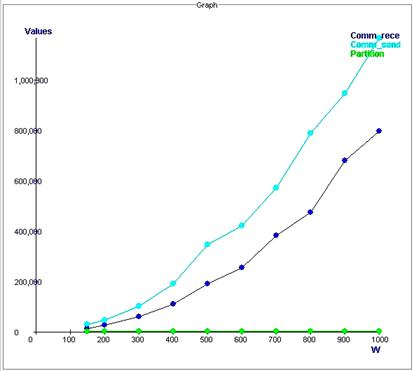
As the picture shown above, it gives the points of some parameters (e.g. speedup, Tp) in function of the problem size (W)
Assuming that you had chosen an experiment from the left side Index Tree, and then you switched to this view. Obviously, additional information of other experiments will needed for this drawing. Relative data will be loaded at the moment of switching, and will be kept in the Data Interface. So that means all data will only be read once.
There is a camera button on the left of the graph. That is used to take pictures of the current graph for the further scientific use. The default path for the picture saving is “C:\”. The default format of the picture is JPEG.
3. Prompt 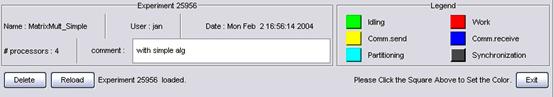
The part of Prompt can be divided into three parts: note, legend and button
Note : it is located on the top-left side in the Prompt. It shows the basic information about the current experiment. Like the experiment name, the user name, the date for the experiment, the number of processors and the comments.
Legend : it is on the top-right side of the Prompt. It indicates that which color stands for what kind of operation. For instance, by default green stands for idling state and red stands for working state. Colors of the view “Execution”, “Performance” and “Overhead” can be changed by double-click the corresponding rectangles.
Button : it is on the lower part of the Prompt. There are three buttons: “Delete”, “Refresh” and “Exit”.
By clicking the “Delete” button, you can delete the selective experiment from the database directly.
The button “Refresh” is only used to reload the whole Index Tree.
The button “Exit” is used to quit the EPPA program.
There is a message box popped out along with each button clicking for confirmation. |